
Know today’s key levels before the market opens
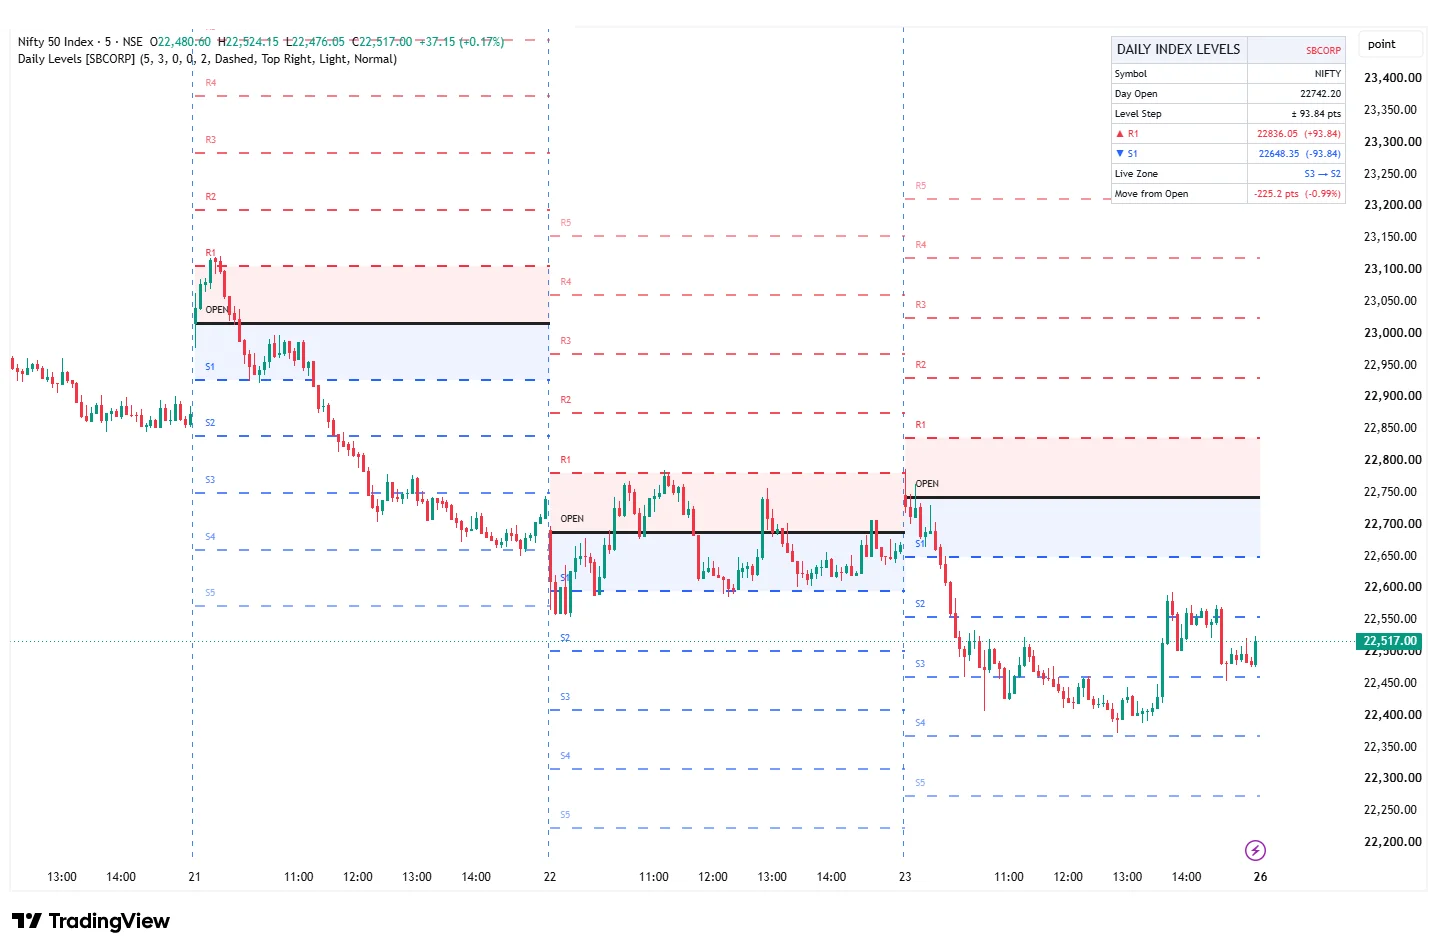
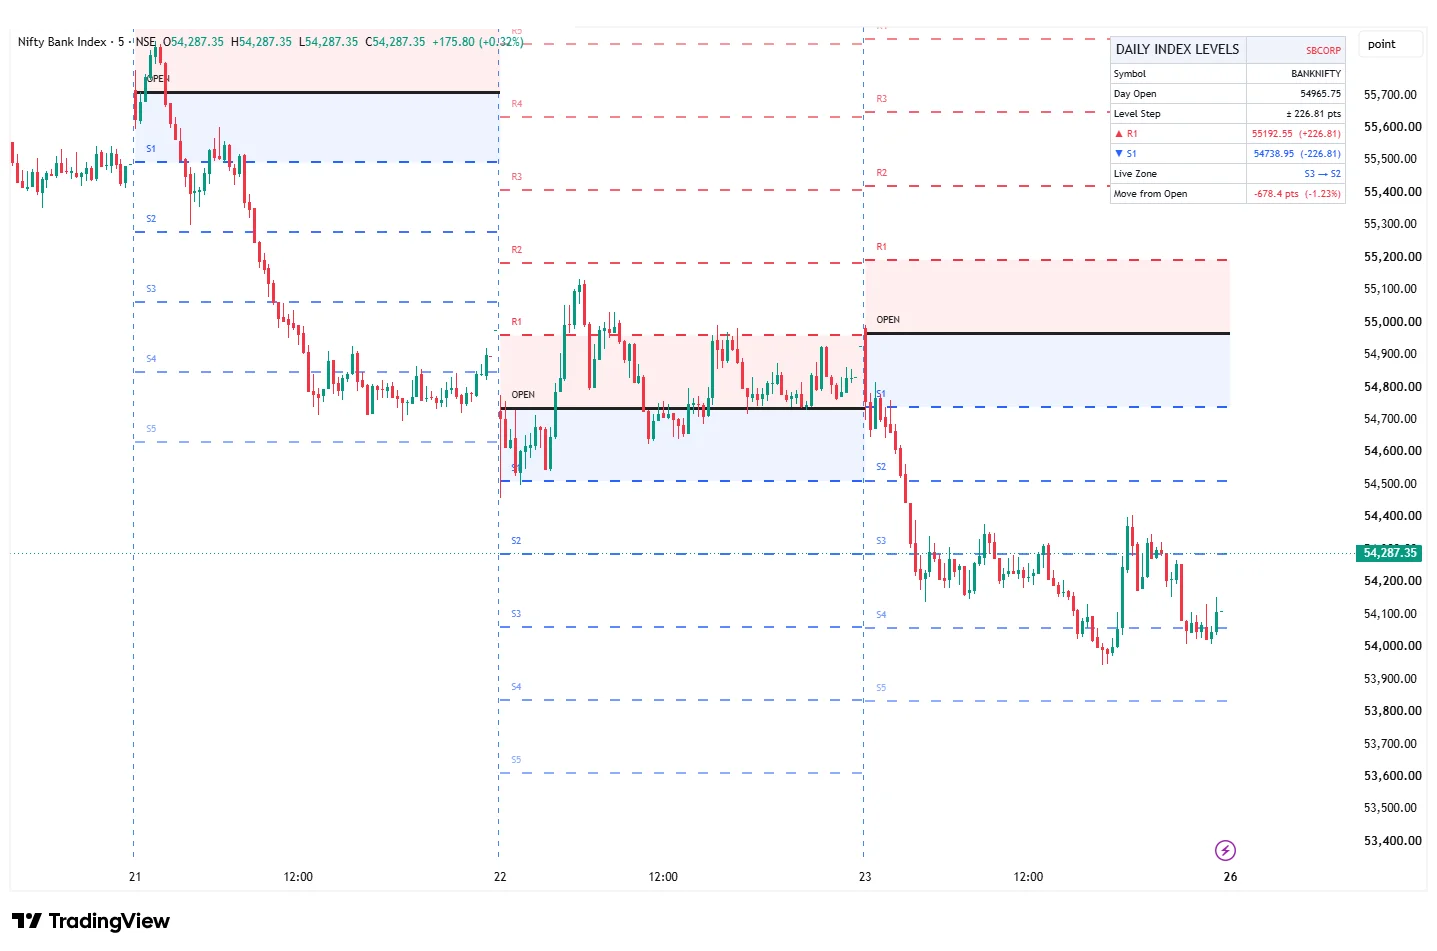
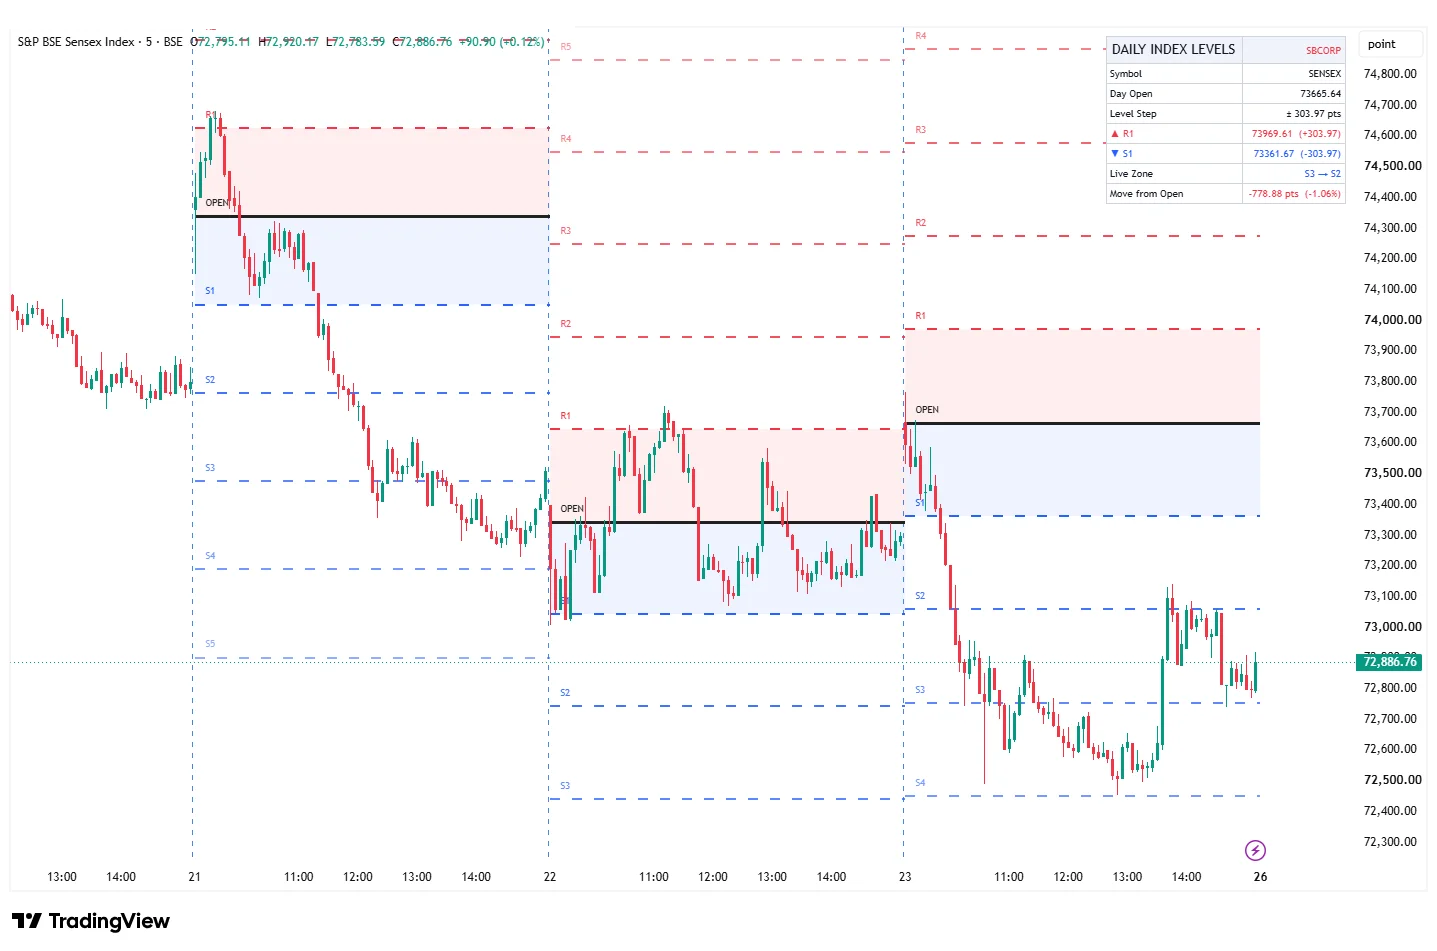
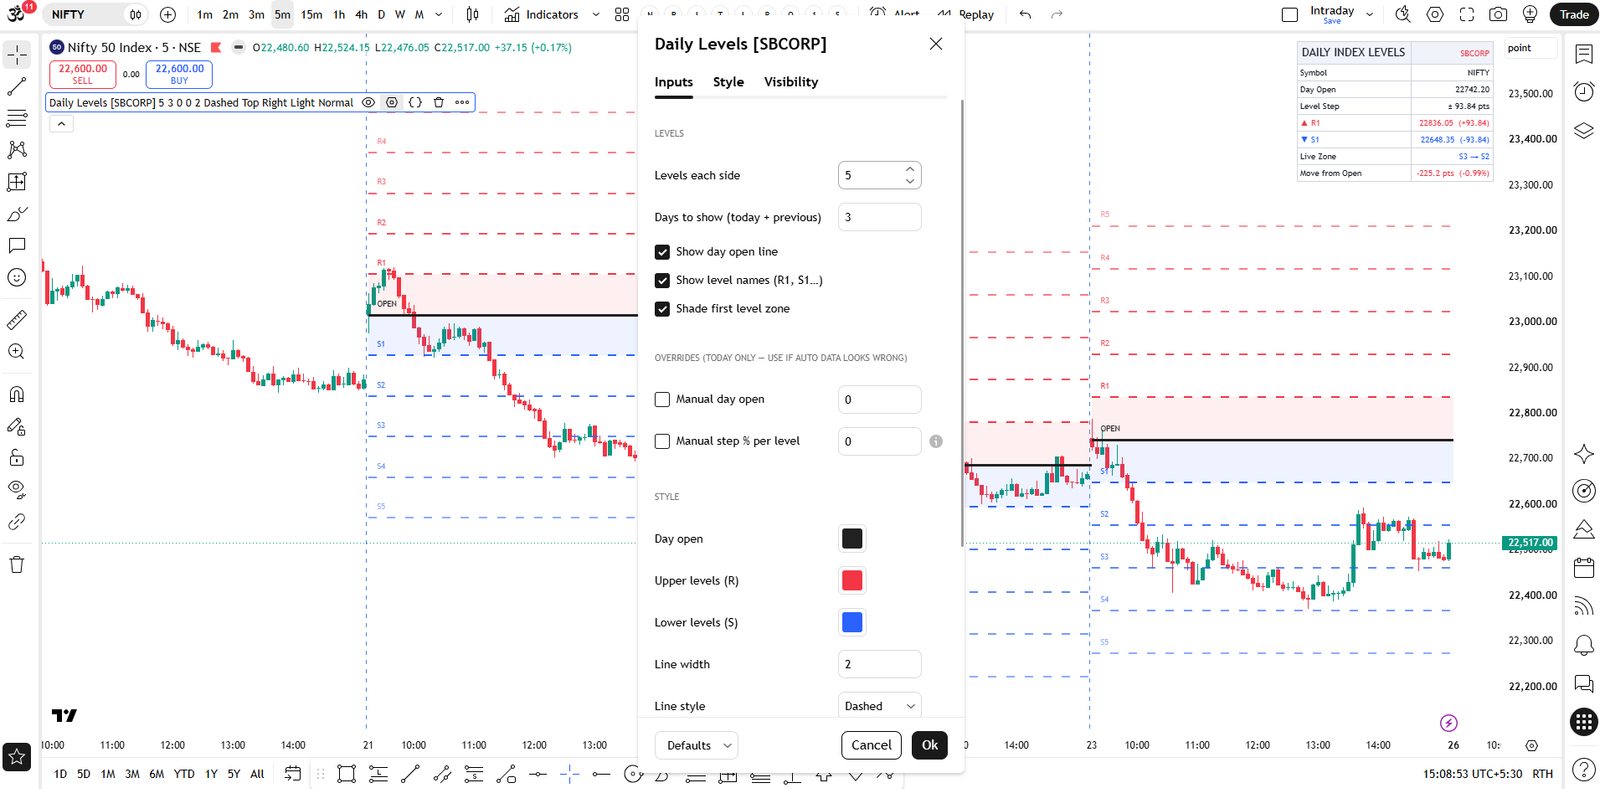
Daily Index Levels [SBCORP] automatically plots the most important intraday price levels for NIFTY, BANKNIFTY and SENSEX at the start of every session — a day open line plus up to 10 upper (R1–R10) and lower (S1–S10) levels that adapt to market conditions every day.
No manual drawing, no calculations. Open your chart and the day’s map is ready.
What you get
- Auto daily levels — fresh R & S levels plotted from the day open, every session.
- Adapts daily — levels widen on volatile days and tighten on quiet days.
- Info panel — day open, level step, R1/S1, live zone (e.g. “R1 → R2”) and move from open, in light or dark theme.
- Shaded first zone — instantly see where price is trading relative to the day open.
- Alerts — cross above R1, cross below S1, cross day open, plus an alert for every level.
- Clean & customisable — colours, line style, number of levels, labels, history of previous days.
- Works on NIFTY, BANKNIFTY, SENSEX, FINNIFTY and other indices — best on 1, 3, 5 and 15-minute charts.
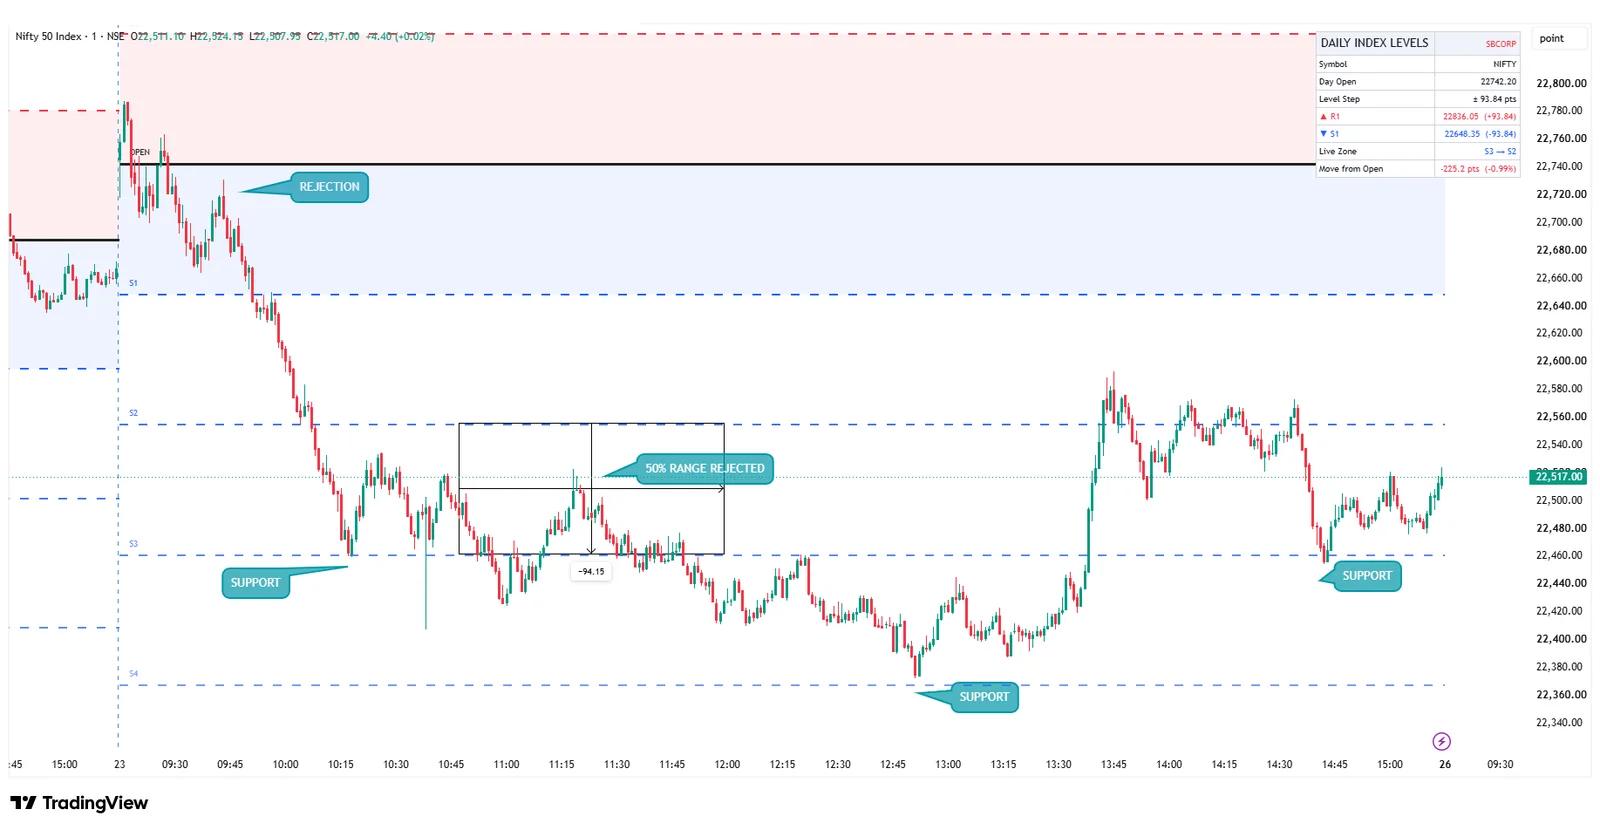
How to read it — real example (NIFTY, 1-minute, 23 Oct)

- Rejection near the open: price tried to climb back to the day open but was rejected inside the first zone — sellers in control.
- Support at S3 / S4: each fall paused at the next S level, giving clear bounce areas.
- 50% of the range: the half-way point between two levels often acts as a turning point — here price was rejected right at the 50% mark.
- M & W patterns: double tops (M) near R levels and double bottoms (W) near S levels give clean, well-defined setups with an obvious stop-loss.
Example shown for learning only. Levels are reference zones, not buy/sell signals.
Customise in seconds
Open the indicator settings (double-click the indicator name) to change how it looks:
- Levels each side — show 1 to 10 levels above and below the open.
- Days to show — today only, or today plus previous days for context (up to 10).
- Show/hide the day open line, level names and the shaded first zone.
- Your own colours, line width and style (solid, dashed, dotted), plus info-panel position, theme and size.

How option buyers use it
- Plan entries near S levels for CE and near R levels for PE.
- Use the next level as a realistic target and the previous level as a stop-loss reference.
- Avoid chasing trades when price is already stretched beyond R2/S2.
How access works
- Buy the 1-year plan and enter your TradingView username at checkout.
- We add your username to the invite-only script (usually within a few hours).
- On TradingView open Indicators → Invite-only scripts and add Daily Index Levels [SBCORP].
Disclaimer: This is a charting/educational tool only. It does not give buy/sell recommendations or investment advice, and SBCORP is not a SEBI-registered investment adviser or research analyst. Past behaviour of levels does not guarantee future results. Options trading carries high risk — trade at your own discretion.
Reviews
There are no reviews yet.